Getting started
A Locust test is essentially a Python program. This makes it very flexible and particularly good at implementing complex user flows. But it can do simple tests as well, so let’s start with that:
from locust import HttpUser, task

class HelloWorldUser(HttpUser):
    @task
    def hello_world(self):
        self.client.get("/hello")
        self.client.get("/world")
This user will make HTTP requests to /hello, and then /world, again and again. For a full explanation and a more realistic example see Writing a locustfile.
Put the code in a file named locustfile.py in your current directory and run locust:
$ locust
[2021-07-24 09:58:46,215] .../INFO/locust.main: Starting web interface at http://*:8089
[2021-07-24 09:58:46,285] .../INFO/locust.main: Starting Locust 2.13.2
Locust’s web interface
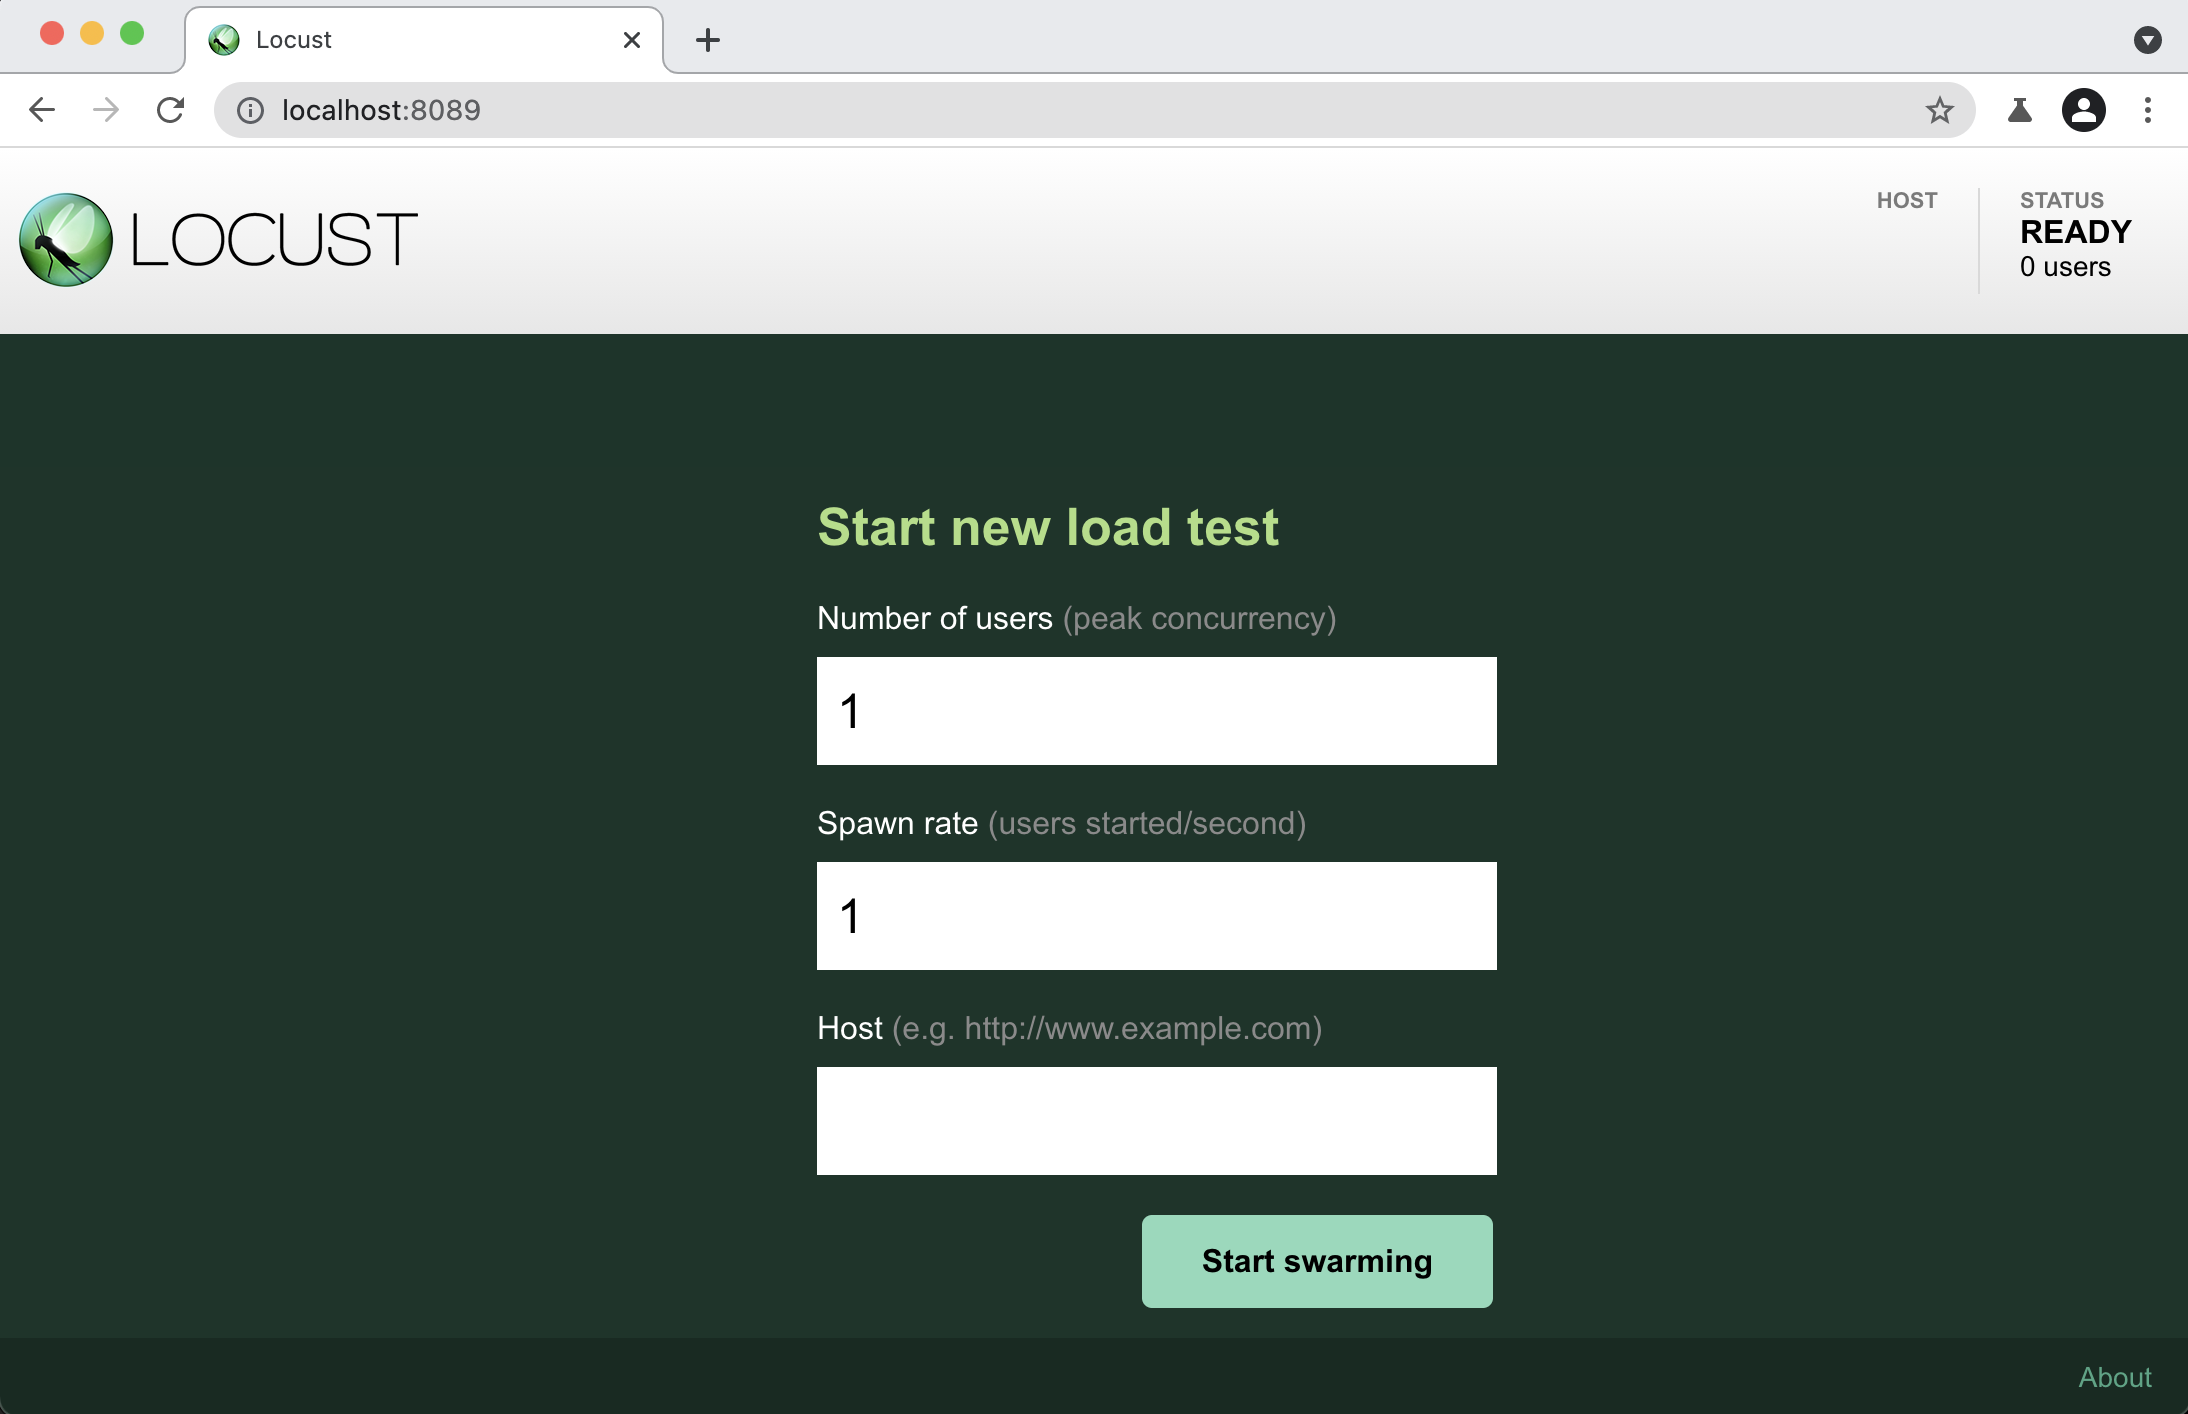
Once you’ve started Locust, open up a browser and point it to http://localhost:8089. You will be greeted with something like this:
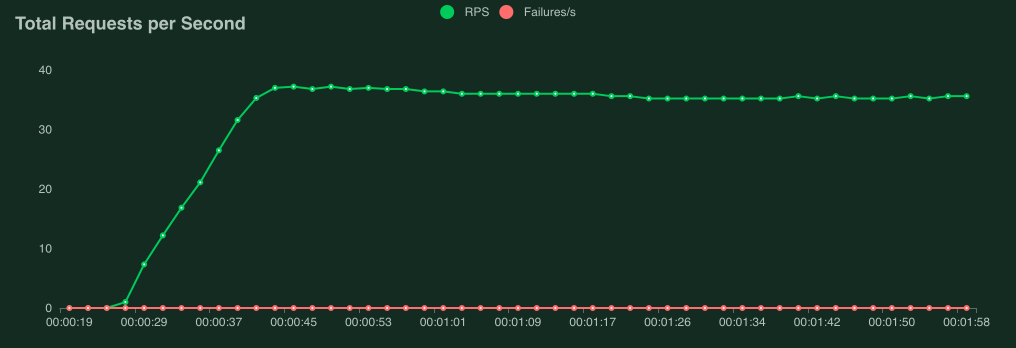
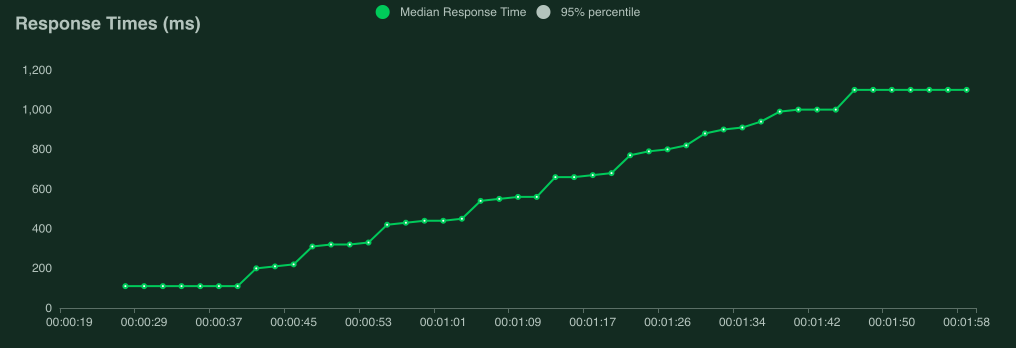
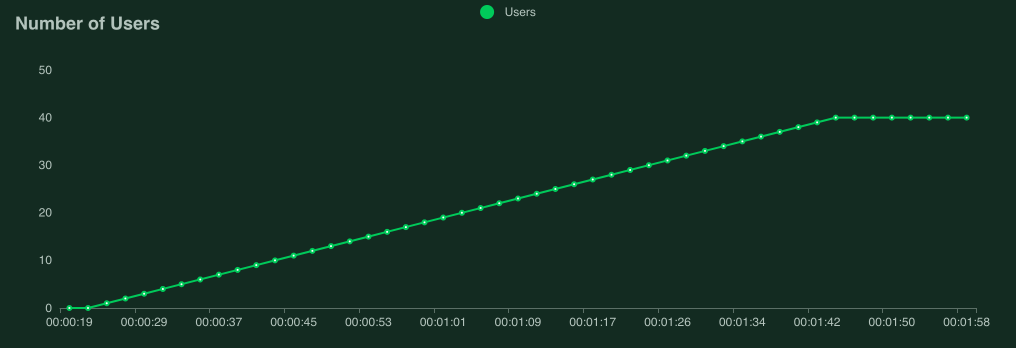
The following screenshots show what it might look like when running this test using 40 concurrent users, with a ramp up rate of 0.5 users/s.
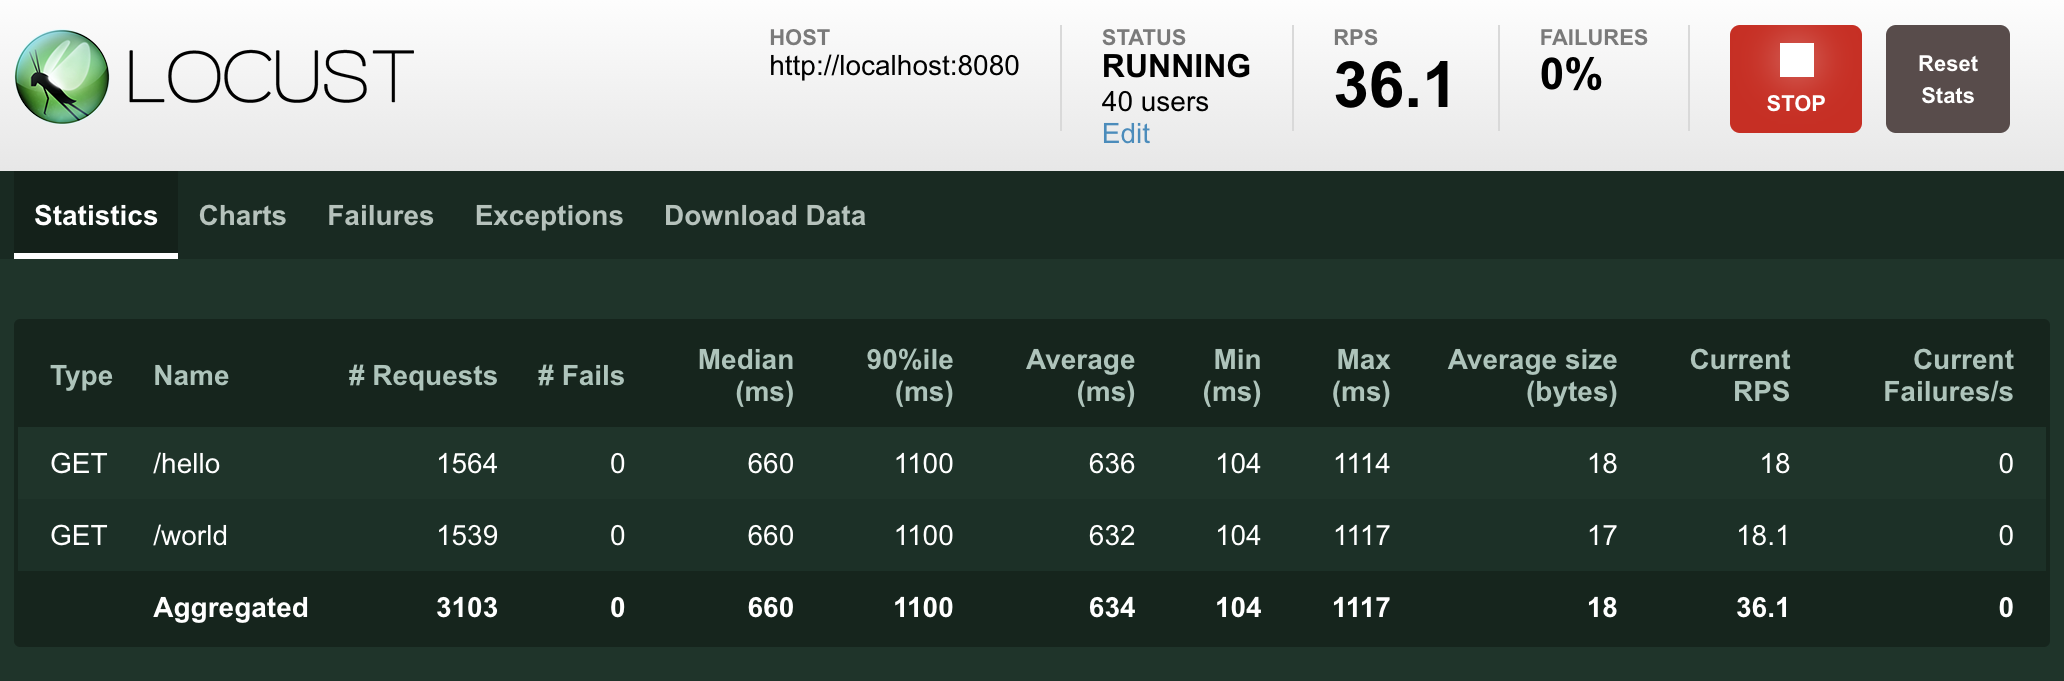
Under the Charts tab you’ll find things like requests per second (RPS):
Response times (in milliseconds):
Number of users:
Note
Interpreting performance test results is quite complex (and mostly out of scope for this manual), but if your graphs start looking like this, the most likely reason is that your target service/system cannot handle the load you are hitting it with (it is overloaded or “saturated”).
The clearest sign of this is that when we get to around 9 users, response times start increasing so fast that the number of requests per second stops increasing, even though new users are still being added.
If need some pointers on how to start digging into a server side problem, or you’re having trouble generating enough load to saturate your system, have a look at the Locust FAQ.
Direct command line usage / headless
Using the Locust web UI is entirely optional. You can supply the load parameters on the command line and get reports on the results in text form:
$ locust --headless --users 10 --spawn-rate 1 -H http://your-server.com
[2021-07-24 10:41:10,947] .../INFO/locust.main: No run time limit set, use CTRL+C to interrupt.
[2021-07-24 10:41:10,947] .../INFO/locust.main: Starting Locust 2.13.2
[2021-07-24 10:41:10,949] .../INFO/locust.runners: Ramping to 10 users using a 1.00 spawn rate
Name              # reqs      # fails  |     Avg     Min     Max  Median  |   req/s failures/s
----------------------------------------------------------------------------------------------
GET /hello             1     0(0.00%)  |     115     115     115     115  |    0.00    0.00
GET /world             1     0(0.00%)  |     119     119     119     119  |    0.00    0.00
----------------------------------------------------------------------------------------------
Aggregated             2     0(0.00%)  |     117     115     119     117  |    0.00    0.00
(...)
[2021-07-24 10:44:42,484] .../INFO/locust.runners: All users spawned: {"HelloWorldUser": 10} (10 total users)
(...)
See Running without the web UI for more details.
More options
To run Locust distributed across multiple Python processes or machines, you start a single Locust master process
with the --master command line parameter, and then any number of Locust worker processes using the --worker
command line parameter. See Distributed load generation for more info.
To see all available options type: locust --help or check Configuration.
Next steps
Now, let’s have a more in-depth look at locustfiles and what they can do: Writing a locustfile.